While working on InterviewPlanner, we started seeing some memory issues on one of our background cron workers. Since InterviewPlanner is a scheduling tool that integrates with a company’s Applicant Tracking System (ATS), we need a way to sync jobs and candidates regularly from the ATS so that we can power our notifications. The background process that was causing trouble was the one that handles the sync from the ATS we integrate with, Greenhouse.
This post chronicles my journey through solving the issues we found. I’ve always personally enjoyed reading about other people’s debugging escapades (I always read it like a classic “whodunit” novel), so I thought I’d document mine as well. And maybe I could help someone else if they’re debugging in the future.
Detecting the issue
We first discovered that there was a problem because the very frequent Greenhouse sync would cause the container that it runs in to run out of memory (OOM) and get killed. While we could have hastily prevented the error by increasing the memory given to the container, it wouldn’t have been a scalable solution. We only have to sync a few moderately-sized accounts right now. As we onboard more companies, the problem would only get worse. In addition, since we’re bootstrapping the company, we don’t have a huge budget to throw at this issue.
When I was originally writing the syncing process, my main concern was speed. For a Greenhouse instance with tens of thousands of candidates and applications, naively syncing the data would take several minutes due to page size limits, request latency, and rate limits from Greenhouse. To offset this, I had optimized for making the process faster in exchange for memory by aggressively caching and preloading. So it’s no wonder the containers were OOMing.
But we didn’t want to over-correct in the opposite direction because the speed of the sync is still really important. If it’s slow, the time between the user first entering their Greenhouse API key to the time everything is populated (and they can continue setting up their account) is prolonged. This hurts the onboarding experience for the user, which we didn’t want to sacrifice. So I needed to be a bit more deliberate with how we solve this problem. But before I dove into making it better, I had to follow the first rule of performance engineering: establish baseline metrics.
Collecting baseline metrics
At this point, we actually didn’t have any metrics. We’re still in the early days of the product, so we decided to punt it for as long as we could. But now it was time to set things up and start collecting basic metrics so that we can be sure that any changes we were making was really solving the problem.
I’ve used Datadog in the past, and while I really liked the product, the biggest con was the cost of it. So instead, we decided to stand up a Prometheus stack. We were already deploying to a Kubernetes cluster, so it wasn’t too difficult to use the Prometheus Helm chart to set everything up easily. This was my first time using Prometheus for a project, so it took me a bit of time to wrap my head around its pull-based methodology, but the docs were great to get me started.
Prometheus was also easy to add to our local environment so that we could monitor everything on our own machines. This helped a lot with iteration speed because it meant that we could make changes locally and see how it affected the app instead of deploying it out to staging first.
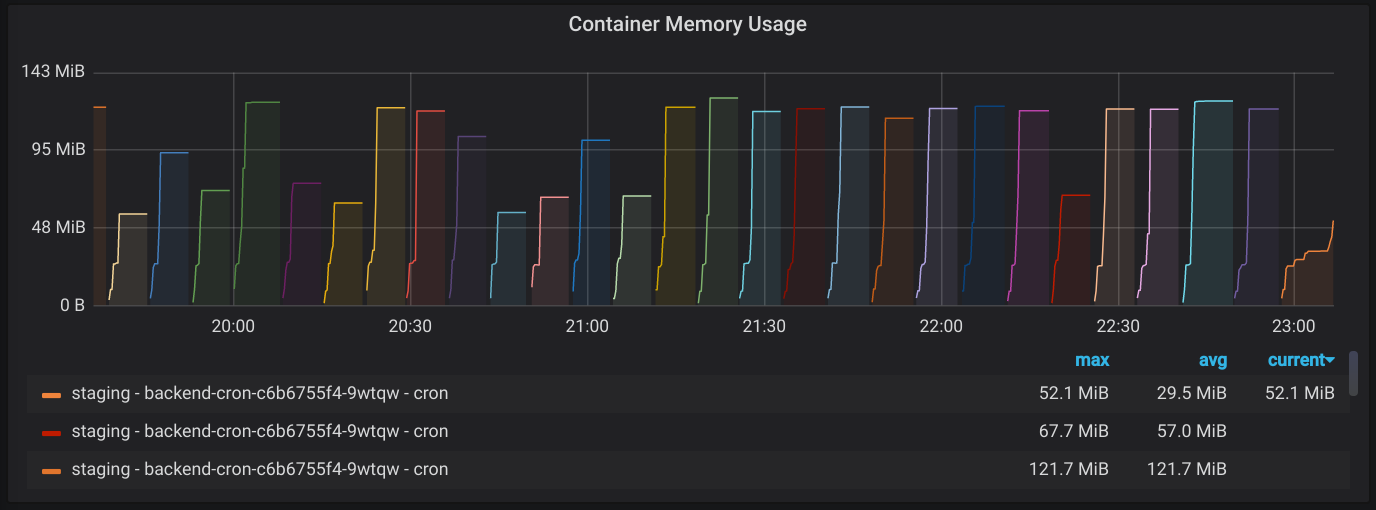
After I set everything up and installed promhttp into the application to
collect and expose basic runtime and process metrics, I was able to see what I
expected to see: the colorful container graveyard. This showed that as soon as
the containers started up and began processing the Greenhouse sync, it would
spike in memory and get killed. And then it would happen all over again once
Kubernetes restarted the container.
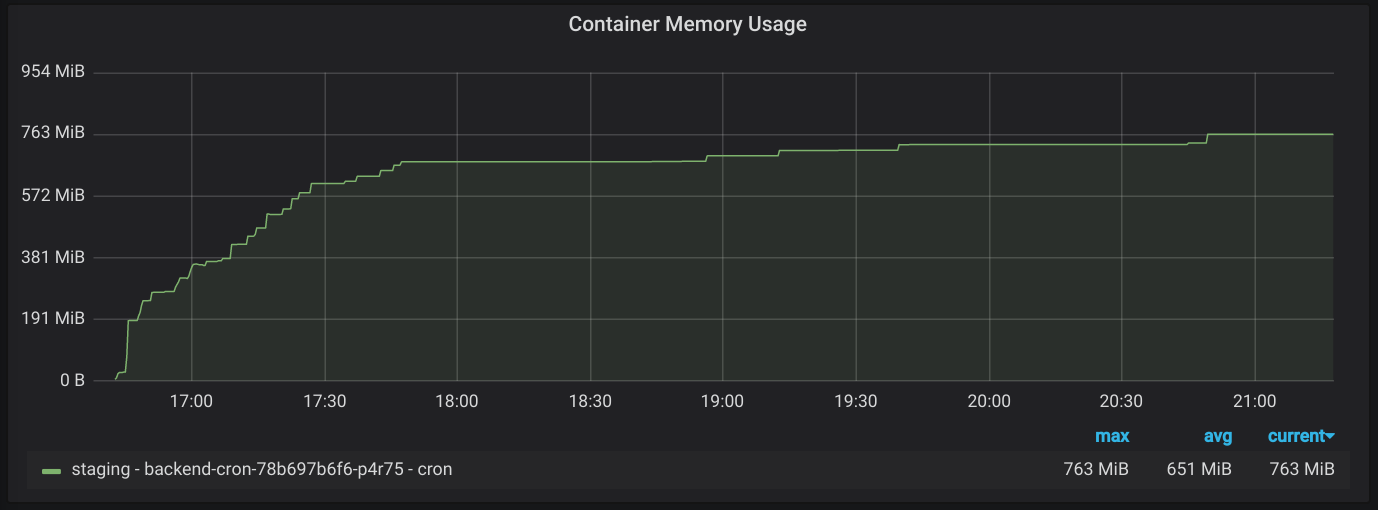
Once I felt pretty good about the metrics collection, it was time to start digging into the issue again. Locally, I wasn’t able to reproduce the killing of the container due to the OOM (I guess Kubernetes is more aggressive about killing misbehaving containers than my local Docker install), but I was able to see that peak memory usage was going over the allotted 128MB. I wanted to know how much memory would be used if it didn’t have a limit, so I increased the memory limit in staging from 128MB to 1024MB. But I found something I wasn’t expecting. Not only was peak memory usage high, but apparently there was also a memory leak.
Plugging the leak
Since reducing peak memory usage wouldn’t have much of an effect if the total
memory was unbounded, I decided to tackle the leak first. So I busted out Go’s
pprof to see if I could get to the bottom of it. I’ve used it in the past to
find goroutine leaks, but I haven’t used their heap profiling before. After
brushing up on the details of the tool (I always go back to this great
post by Julia Evans),
I saved a profile and inspected the flamegraph view to see if I could find a
culprit.
go tool pprof -http :4321 -sample_index=inuse_space http://localhost:2113/debug/pprof/heap
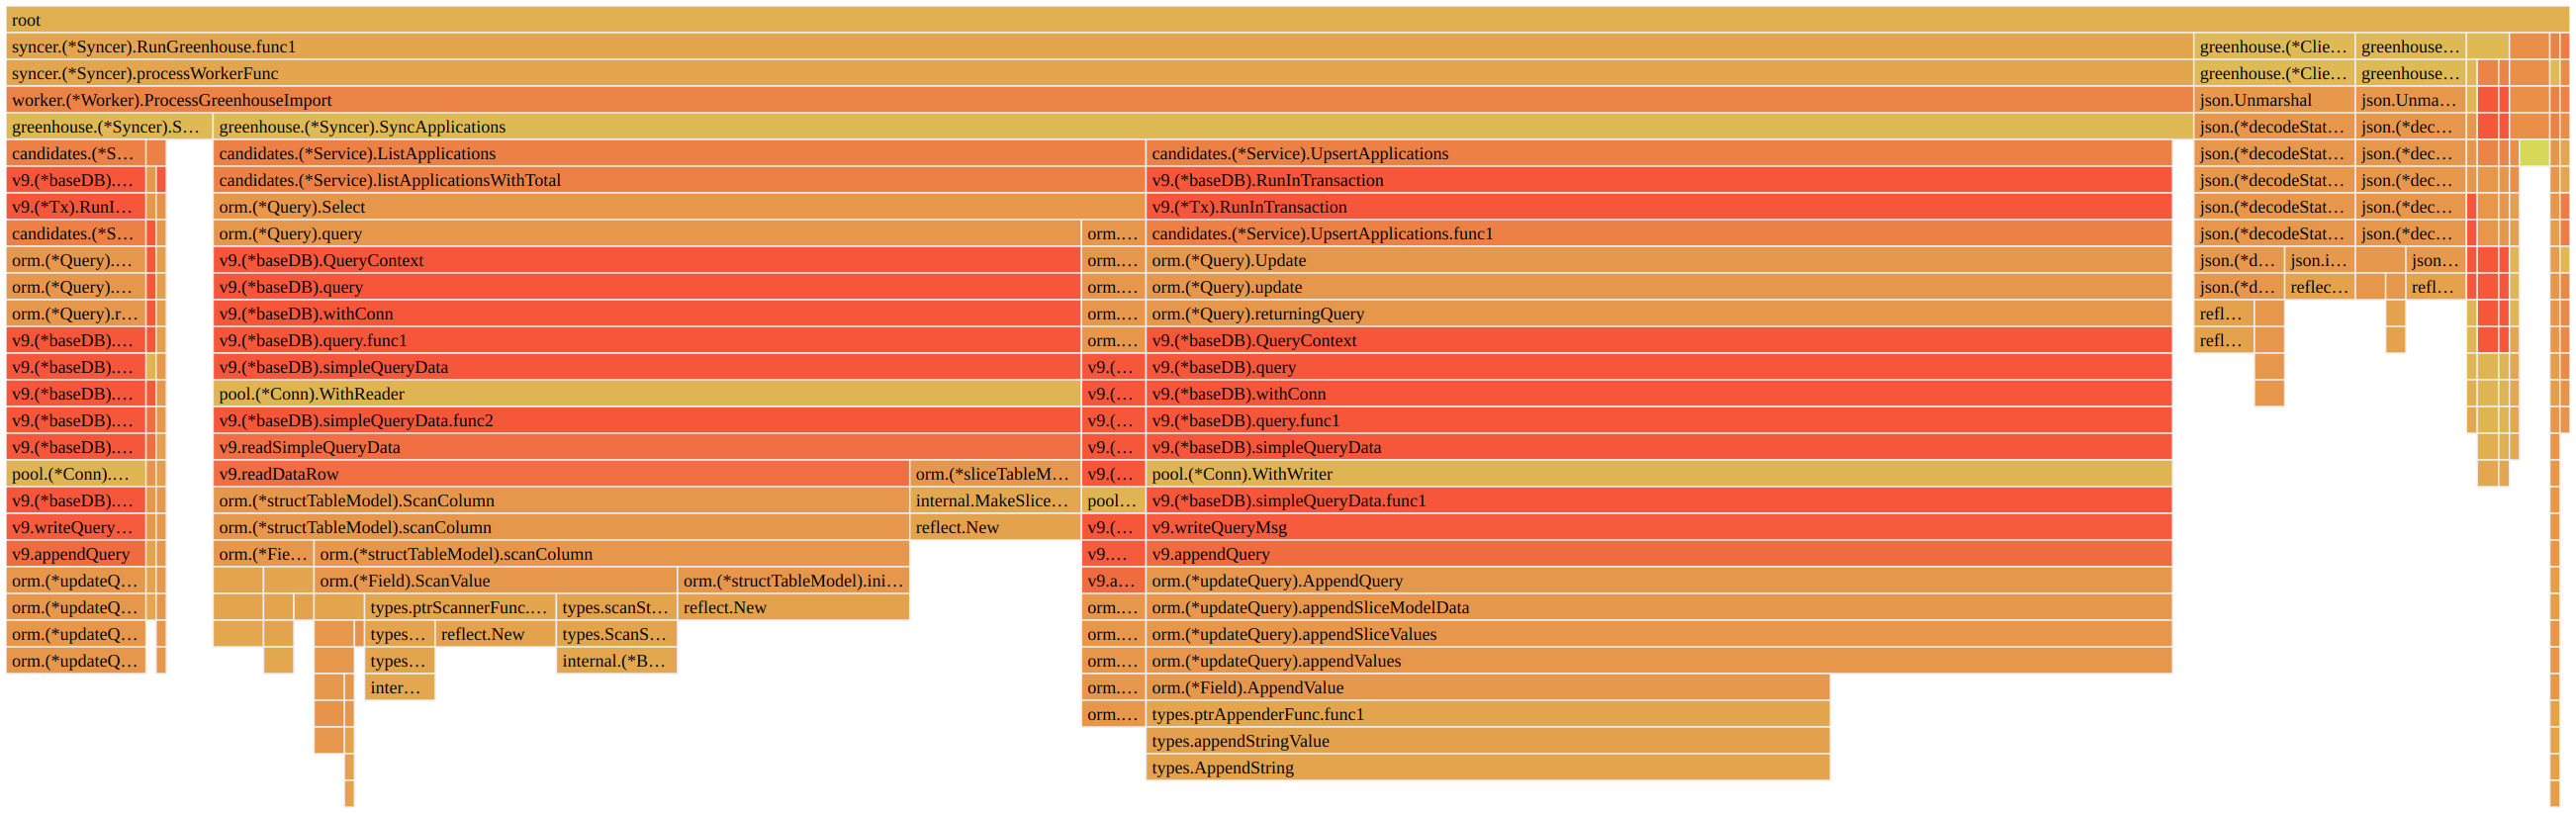
From the looks of it, it seemed like a lot of memory was being retained by the
ORM that we use, go-pg. I checked the issues on GitHub, and nothing mentioned
memory usage at all, but maybe it was a bug that was patched without an issue.
So I compared the version I was running (v9.0.0-beta.15) to the latest version
(v9.1.2) and went through the 40
commits in
between. And lo and behold, I found this one: “internal/pool: use sync.Pool for
WriteBuffer to reduce memory usage on huge
writes”.
And it lined up too because we were doing fairly large upserts to avoid
round-trips to the DB. So I did the extremely easy upgrade to the latest version
to see if that changed anything, and that did the trick.
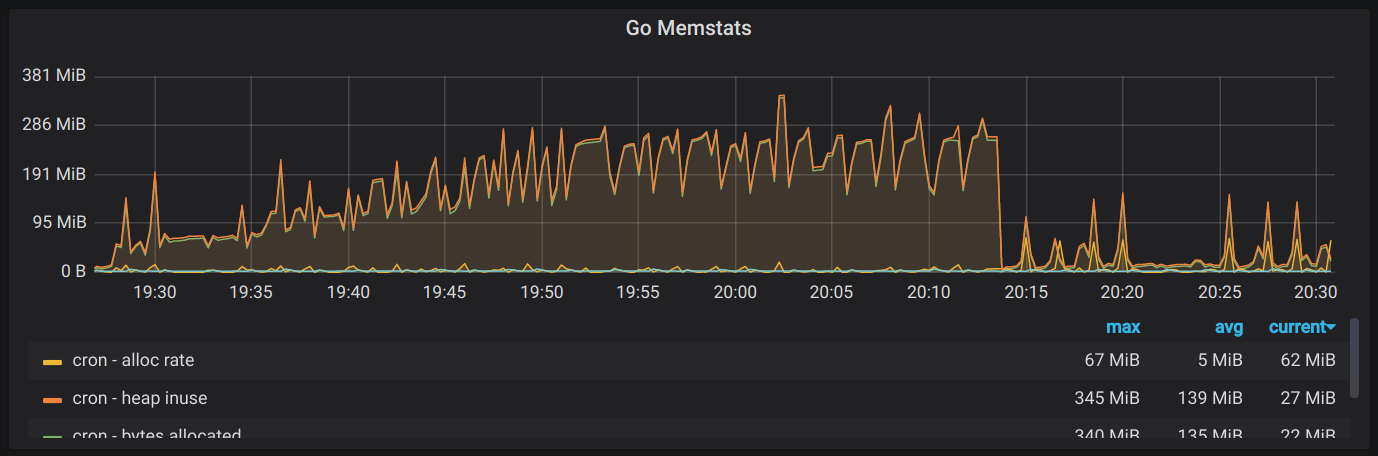
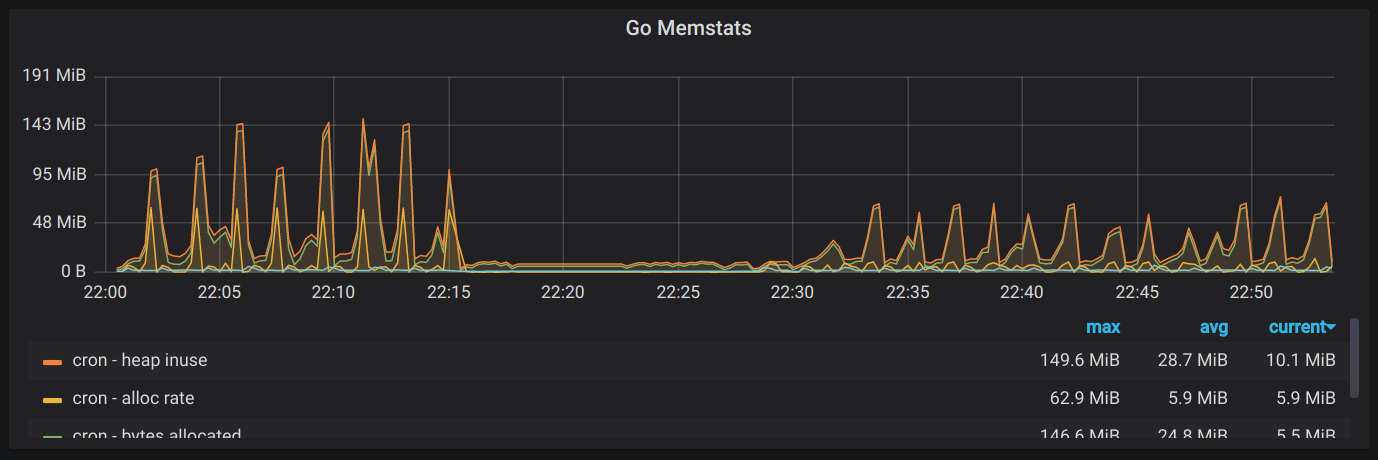
With the memory leak fixed, I could see that we were peaking at around ~190MB, so now it was time to move onto the main event.
Changing business requirements
My first train of thought to bring memory usage down was to see what structs we were allocating and whether we could either release them sooner or just not allocate them at all. To give you an overview of our syncing process with external services, we originally wanted to cover these 3 cases:
- If we pull a resource from the external service, and we don’t have that resource saved, insert it into the DB.
- If we pull a resource from the external service, and we do have that resource saved, update it in the DB.
- If there is a resource in the DB that doesn’t exist in the external service anymore, mark it as archived/deleted.
To be able to accomplish all 3, we needed to look at all of the resources in the
database for an account and all of the resources in that account’s Greenhouse
instance at the same time. So if an account has 50,000 applications, we could
potentially have 100,000 Application structs allocated, effectively doubling
our memory footprint.
While it’s absolutely necessary to accomplish the first 2 points (which is fairly easy with the DB upsert), point #3’s utility was a bit less clear. We wanted to support auto-archiving when things disappear from the source of truth, but in reality, this is a very rare occurrence. Not only does Greenhouse actually make it very difficult to delete resources, but we’ve seen that most companies actually prefer to keep historical data around. And even if someone does delete something, we give the ability to archive through our dashboard as well, so users can still keep things clean.
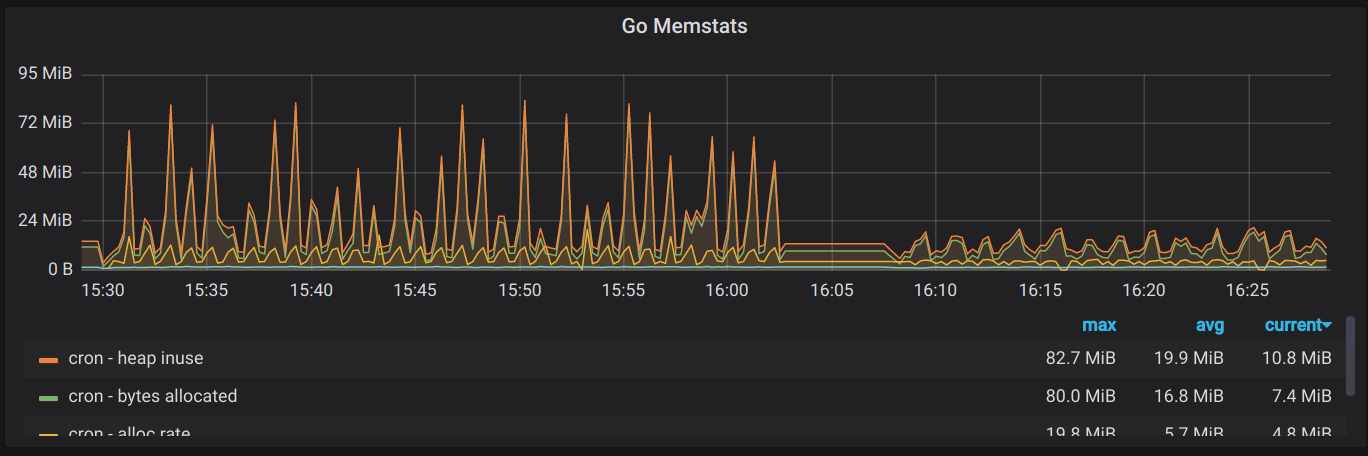
As a result, we decided to lift the requirement of point #3, which meant that we no longer had to fetch all of the resources from the DB. And after implementing it, we did see a reduction in memory usage from ~190MB to ~90MB.
Paging through results
As I mentioned before, my original goal was speed. One of the optimizations I did at that time was to fetch all resource pages from Greenhouse concurrently. So for example, if we wanted to fetch all applications with a max page size of 500, we would make the request to page 1, inspect the header that told us that the last page was 100, and then kick off 99 coordinated goroutines to fetch the rest of them while retrying on rate limit errors.
But I wanted to see what the time/space trade-off for this decision actually was. So I refactored things a bit; instead of fetching all resources, I processed each page fully before moving onto the next one. And this had some pretty good outcomes.
We were able to bring max memory usage down to ~21MB (almost a 10x improvement from the beginning), without sacrificing too much on time. When doing things concurrently, it took about 1m15s to handle all applications for a given account, and when paging through it, it slowed down to about 2m15s. It’s still workable as a full sync of all of the data, but the next step is to prioritize the initial sync that occurs when a user first connects their Greenhouse instance and make that one faster separately, since that’s the sync that affects the user’s onboarding experience.
Closing things out
Overall, I’m very happy with the results. This definitely isn’t the end of refactoring this worker, but I think this has bought us a decent amount of time so that we don’t have to touch it for a while. And I learned a lot along the way, which is always fun. Some key takeaways from the adventure:
- Before you start working on performance, make sure you measure where you’re currently at so you know how much impact your work is actually doing.
- Always check your dependencies. Make use of the fact that most of what we rely on is open-source.
- Everything is a trade-off. Figure out what makes the most sense from both a technical perspective and a business perspective.